Pavum Graphics

Syntax for using pavum graphics :

1) line --> line x1 y1 x2 y2 3 : takes the coordinates of starting and ending point , last parameter for colour
2) pset --> pset x y 3 : takes x and y coordinate for the point , last parameter for colour

Drawing A Circle:

python
#### license: creative commons cc0 1.0 (public domain)
#### http://creativecommons.org/publicdomain/zero/1.0/
fig

p 0 minus 3.14159
while
now = p
p = now plus 0.1
x = p cos times 15 plus 250 int
y = p sin times 15 plus 250 int
v = p cos times 10 plus 250 int
q = p sin times 10 plus 250 int
var line x y v q 2

ifmore p 3.14159
break
fig

wend

now "" lineinput
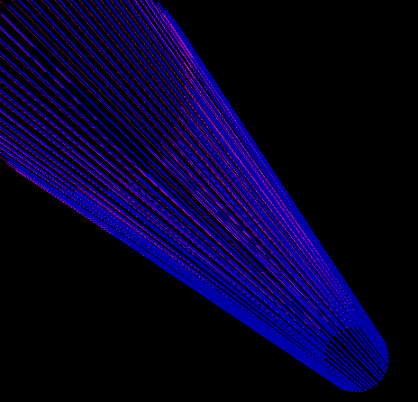
Another Example:

python
#### license: creative commons cc0 1.0 (public domain)
#### http://creativecommons.org/publicdomain/zero/1.0/
fig

p 0 minus 3.14159

while
now = p
p = now plus 0.1
x = p cos times 36 plus 400
y = p sin times 36 plus 400
x2 = p cos times 121 plus 90
y2 = p sin times 121 plus 90
var linewidth 1
var line x y x2 y2 5
x3 = x2 plus 10
y3 = y2 plus 5
var linewidth 3
var line x y x3 y3 1

ifmore p 3.14159
break
fig

wend

now "" lineinput